|
|
|
Integration Types for Leaving cert. Honours Mathematics
Maxima, Minima & Points of Inflection
Notes:
Example
: If y = x3 + 2x2 + 3x + 2, find the slope of the tangent to the curve at the point (1 , 8).Solution: f ' ( x) = 3x2 + 4x + 3 and when x = 1, f ' ( x) = 3(1)2 + 4(1) + 3 = 10.
i.e. at (1 , 8) the slope of the tangent to the curve f(x) = x3 + 2x2 + 3x + 2 is 10.
Maximum and minimum points:
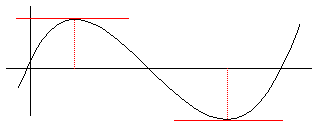
Maximum & minimum points of any curve are called
stationery points. In the above diagram the red lines represent tangents drawn to the curve at the local maximum and minimum points. As can be seen from the diagram these tangents are parallel to the x - axis, i.e. they have a slope of 0. But differentiation gives a method of finding the slope of tangents to curves so:Solve the equation![]() = 0, to give the values of x at which the maximum and minimum points occur.
= 0, to give the values of x at which the maximum and minimum points occur.
Let us now consider the graph f(x) = x3 - 6x2 + 9x - 10. In order to draw this graph we do out a table:
|
0 |
1 |
2 |
3 |
4 |
5 |
|
|
x3 |
0 |
1 |
8 |
27 |
64 |
125 |
|
-6x2 |
0 |
-6 |
-24 |
-54 |
-96 |
-150 |
|
+9x |
0 |
9 |
18 |
27 |
36 |
54 |
|
-10 |
-10 |
-10 |
-10 |
-10 |
-10 |
-10 |
|
-10 |
-6 |
-8 |
-10 |
-6 |
19 |
To find the slopes of the tangents to the graph at each of the above points we make out another table using f ' ( x) = 3x2 -12x + 9 and graph this as well
|
0 |
1 |
2 |
3 |
4 |
5 |
|
|
3x2 |
0 |
3 |
12 |
27 |
48 |
75 |
|
-12x |
0 |
-12 |
-24 |
-36 |
-48 |
-60 |
|
+9 |
9 |
9 |
9 |
9 |
9 |
9 |
|
9 |
0 |
-3 |
0 |
9 |
24 |
To find the slopes of the tangents to this second graph at each of the above points we repeat the procedure i.e. we make out another table using f ' ' ( x) = 6x - 12.
|
0 |
1 |
2 |
3 |
4 |
5 |
|
|
6x |
0 |
6 |
12 |
18 |
24 |
30 |
|
-12 |
-12 |
-12 |
-12 |
-12 |
-12 |
-12 |
|
-12 |
-6 |
0 |
6 |
12 |
18 |
These three graphs should show us the relationship between the turning points and the differentiation process. We draw these three graphs underneath each other as follows:
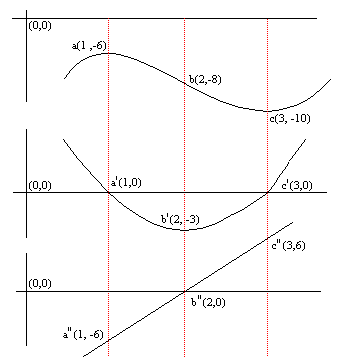
The following points should be clear from the graph:
In General: For a maximum point f ' (x) = 0 and f ' ' (x) < 0
In general: For a minimum point f ' (x) = 0 and f ' ' (x) > 0
In general: For a point of inflection, f ' ' (x) = 0
Notes 4 and 5 above lead to a definition for the maximum and minimum points:
Local Maximum Point: A point on a curve at which the curve changes from an increasing function to a decreasing function.
Local Minimum Point: A point on a curve at which the curve changes from a decreasing function to an increasing function.
Point of inflection: A point on a curve at which the curve changes from being concave downwards to concave upwards or vice versa.
A quadratic function has 1 maximum OR minimum
A cubic equation has 1 maximum, 1 minimum and 1 point of inflection. It can happen that the three of these may coincide (e.g. in the function y = x3). When this occurs the resulting point is called a Saddle point.