Theory (intermediate)
Charts have been provided HERE to make it easier to understand the project test results by converting the numerical database into pictorial "family trees". Participants who are unfamiliar with the technical jargon of genetic genealogy will more easily grasp how the tested families fit together on the overall family tree. Participants who have gradually grown accustomed to the technology behind the charts may be interested to delve a little deeper to find out just what the charts mean, so a little technical information is being provided here as a primer to the subject. Click HERE to access a selection of academic papers on the subject.
Technical Information
Our project participants and other interested members frequently ask searching questions about the "blobs and lines" (or "phylogenetic network" as each chart is formally termed) that have been conjured up in our attempts to make sense of the test results and our shared heritage. Here are some of the fundamental questions and answers:-
- What kind of software is used to produce the charts?
- Why are some of the "blobs" bigger than others, and why are some "lines" longer?
- Why doesn't my test kit number appear next to my "blob"?
- Do all markers mutate at the same rate?
- Are all 37 markers used in the charts?
- Are there any other points to bear in mind?
- "Unfortunately, phylogenetic analysis is frequently treated as a black box into which data are fed and out of which 'The Tree' springs."
(Swofford et al. 1990) - "Molecular phylogeneticists will have failed to find the 'true tree', not because their methods are inadequate or because they have chosen
the wrong genes, but because the history of life cannot properly be represented as a tree."
(Doolittle 1999)
We have used a programme called NETWORK (version 4.6.1.2, released 1 Jan. 2014) to process the most recent test results and then draw the charts. The programme was originally designed for DOS by Dr. Arne Röhl in 1997 (then a doctoral maths student at the University of Hamburg) incorporating various analytical algorithms, and then subsequently developed for Windows in conjunction with Fluxus Technology Ltd. The programme is regularly upgraded as development continues, and the latest version may be downloaded free of charge from the Fluxus website. The algorithms include reduced-median networks (Bandelt et al. 1995), time estimates (Morrel et al. 1994; Forster et al. 1996), median-jointed networks (Bandelt et al. 1999), time estimate standard errors (Saillard et al. 2000), star contraction (Forster et al. 2001), and maximum parsimony (Polzin et al. 2003). We are very grateful to Fluxus Technology Ltd. and their academic colleagues, and greatly appreciate their significant contribution to the field of genetic research.
Each "blob" (or "node" as it is formally known; also called a "taxon", plural "taxa", in genetic circles) represents a unique test result. If two or more tests share exactly the same result, then the programme automatically increases the size of the node. The area of the node is directly proportional to the number of test results represented by the node. Similarly, the length of each "line" (or "branch") is proportional to the number of mutational steps between the nodes. The groups and subgroups are coloured coded to ease identification, and a black wedge is shown in the large nodes to indicate the number of results represented by the node. The size of the wedge corresponds to a single result.
Each node is initially identified by a unique test kit number. If two or more tests share exactly the same result, then the programme automatically names the node after the lowest kit number in the cluster. We have negotiated this hurdle by providing a table listing the best three matches to each result.
No. In the early days of genetic research in the late 1990s, the pioneering anthropologists and geneticists, such as Dr. Evelyne Heyer, determined an average mutation rate of 0.002 for the 7 markers that they used. The value of 0.002 was intended to denote a rate of 0.2% mutations per generation (or 1 mutation per 500 generations, if you turn it around). This seemingly crude estimate was appropriate to the 7 markers used at the time and appeared to fit their data to their corresponding ancestral research. In hindsight, the Heyer estimate was based on a modest database (42 individuals within an indigenous Canadian tribe of reputed common ancestry) using relatively few markers by modern standards (DYS 394, DYS 390, DYS 391, DYS 393, DYS 389, DYS 385a and DYS 385b), but it is still often quoted. Subsequent researchers, such as Prof. Manfred Kayser, computed significantly higher average mutation rates.
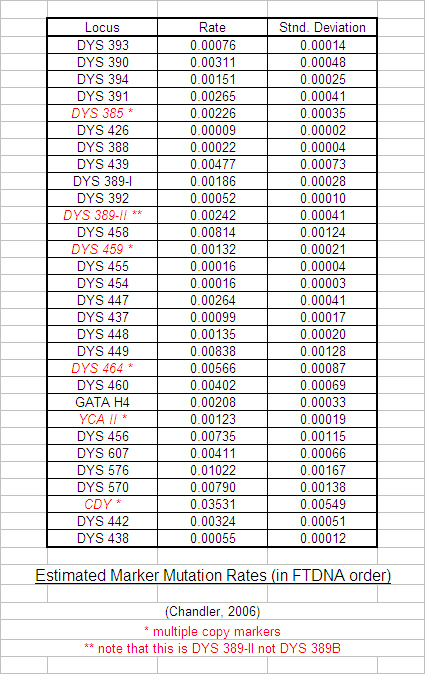
As the number of tested markers grew from half a dozen to a dozen to two dozen, leading researchers such as Family Tree DNA (FTDNA) and the University of Arizona (UA) soon realised that some markers tended to mutate much faster than others. Various mutation rates have been calculated for each new marker (John F. Chandler estimated mutation rates for all of FTDNA's 37 markers in 2006 by number-crunching 8,430 Y haplotypes downloaded from the Ysearch database; see table below) but the accuracy is essentially dependent on a curve-fitting exercise that in turn relies on both reliable ancestral research and large sample size for its integrity. Most recently, it has become increasingly apparent that marker mutation rates are specific to ancestral groups and subgroups, so the global estimates for typical mutation rates between groups must be used with great caution within groups.
Past studies at Trinity College Dublin (TCD), such as research by Dr. Brian McEvoy, have used the calculated Variance of the marker Repeat Numbers as a rough gauge of relative mutation rates in order to apply an appropriate statistical weight for the estimation of time to most recent common ancestor. We followed their example when we achieved a large enough database (60 no. R1b results in April 2007) and the initial results of our statistical analysis are tabulated below.
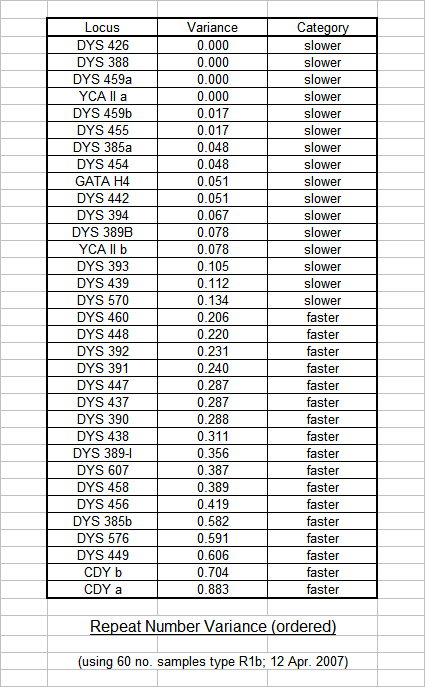
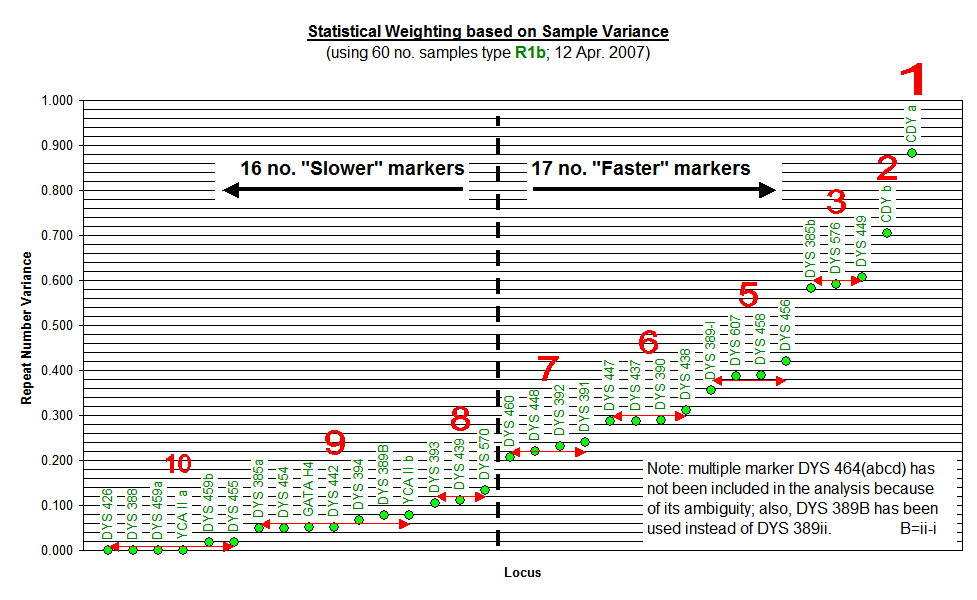
The results were then graphed and markers with similar repeat values were clustered together in ascending order. Statistical Weights were arbitrarily assigned (in line with the TCD format) to each cluster of markers for use with the phylogenetic software, and an arbitrary division was assigned to differentiate between apparent "Slower" markers and "Faster" markers. It is interesting to note that only 7 of our 17 "Faster" markers have been designated as "Fast" by FTDNA, and illustrates the point that the statistical analysis of test results specific to Flannerys and Flannellys is much more relevant to us than general worldwide studies that include Eskimos, Pygmies and other diverse ethnic groups who may not necessarily share our genetic traits.
Our most recent update of this procedure (using 81 no. R1b results in March 2009) provided a glimpse of some interesting trends. Whilst the updated variance of the marker Repeat Numbers did not significantly change, a similar check on variance within each of the two main groups (that is, 37 no. Munster results and 30 no. Connaught results) clearly demonstrated that a significant amount of variance was due to the typical difference between groups not within groups. This revelation supports the theory that mutation rates are specific to ancestral groups and subgroups, and the adoption of general mutation rates (even for groups within clades and subclades) is inappropriate within groups and subgroups. On that basis, we have decided to restrict the categorisation of "Slower" and "Faster" markers to the purpose of illustrating the diverse groups within the project, and we shall not use mutation rates within specific groups until group-specific mutation rates can be established by our own test results.
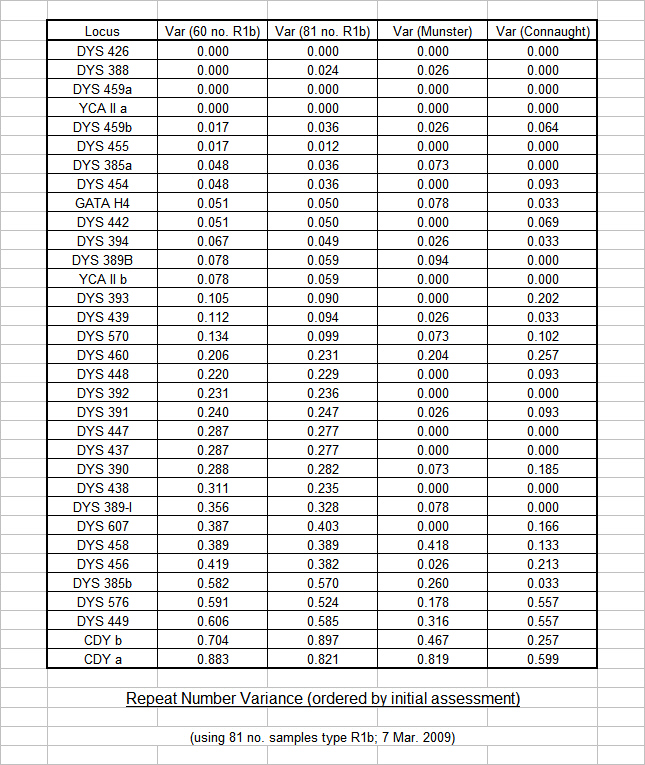
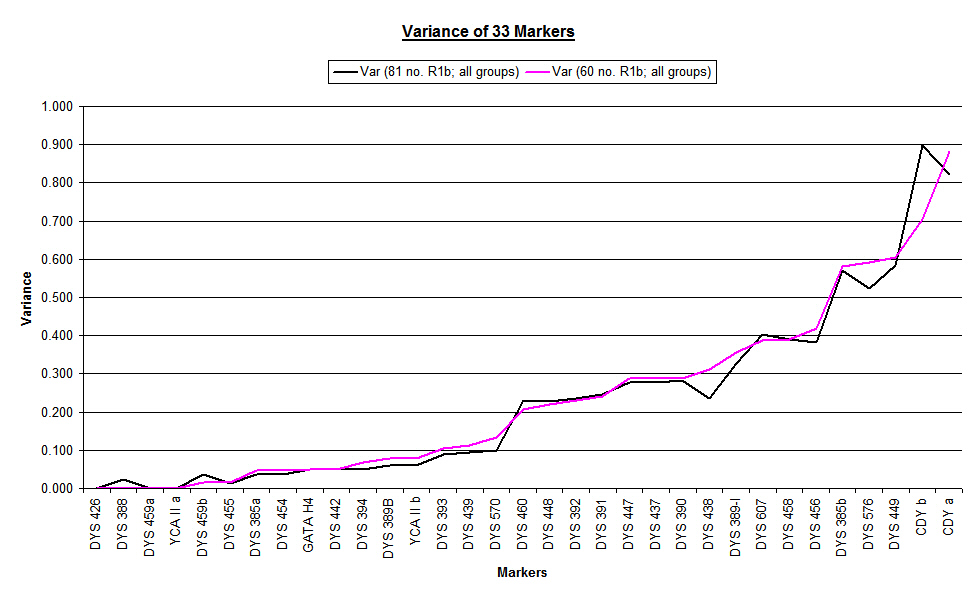
The following chart shows the nominal changes that appeared when the updated overall variance (black line) was graphed against the initial overall variance (pink line). The changes were small, but prompted us to take a closer look.
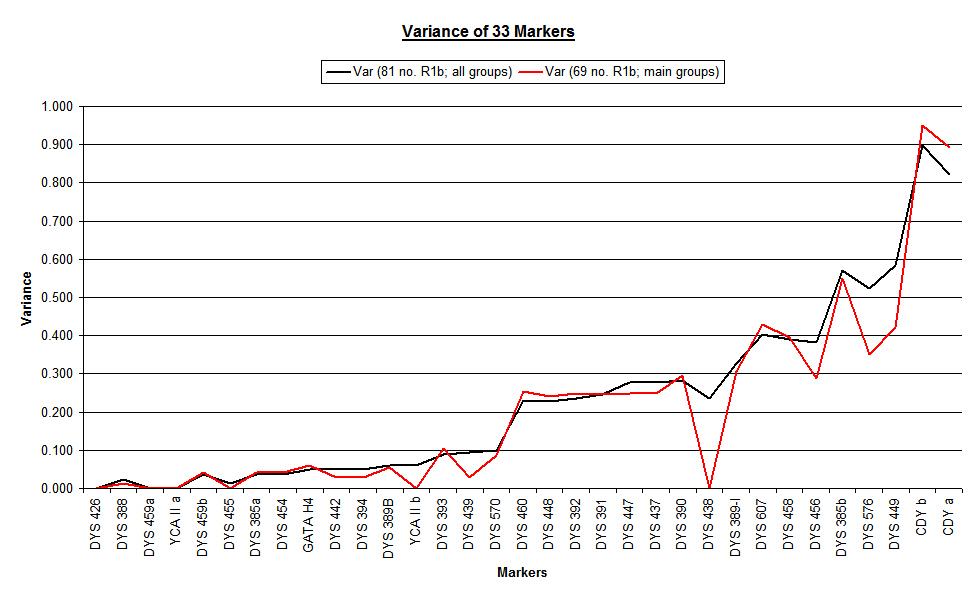
The next chart shows the significant changes that emerged when the updated overall variance (black line) was graphed against the variance of the two main groups considered as a single database (red line). The changes were dramatic at a number of locations on the graph, and prompted us to take a detailed look at each of the individual main groups.
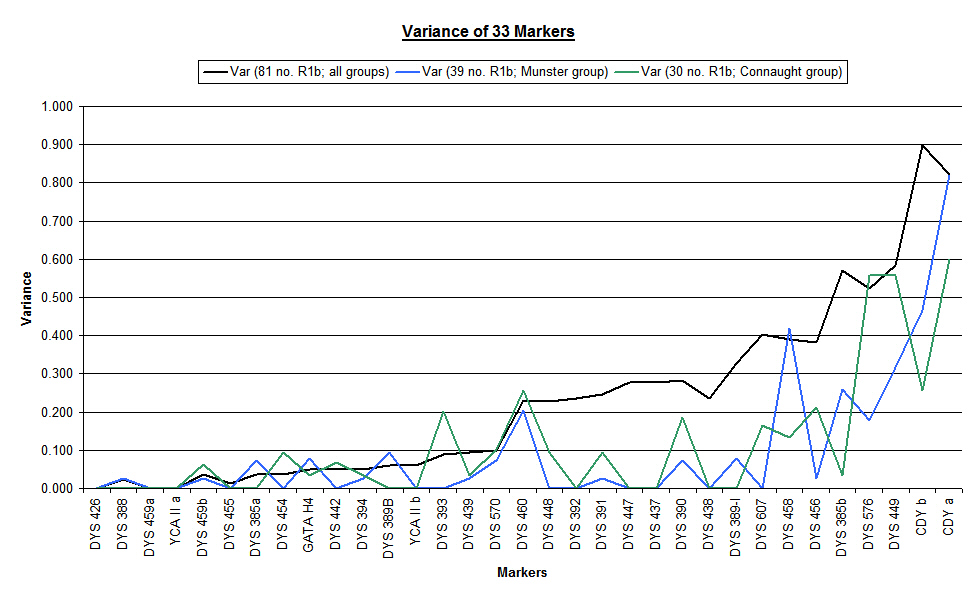
The following chart shows the updated overall variance (black line) graphed against the variance of each of the two main groups considered as individual databases (blue line for Munster Flannerys and green line for Connaught Flannerys). In many locations the "saw tooth" profile of the individual databases are out of phase but are cancelled out by the smoothing effect of the overall analysis. In some locations, the individual variance of the groups is zero, but the overall analysis shows a high variance due to the difference in marker repeat numbers - thus giving a false impression of volatility.
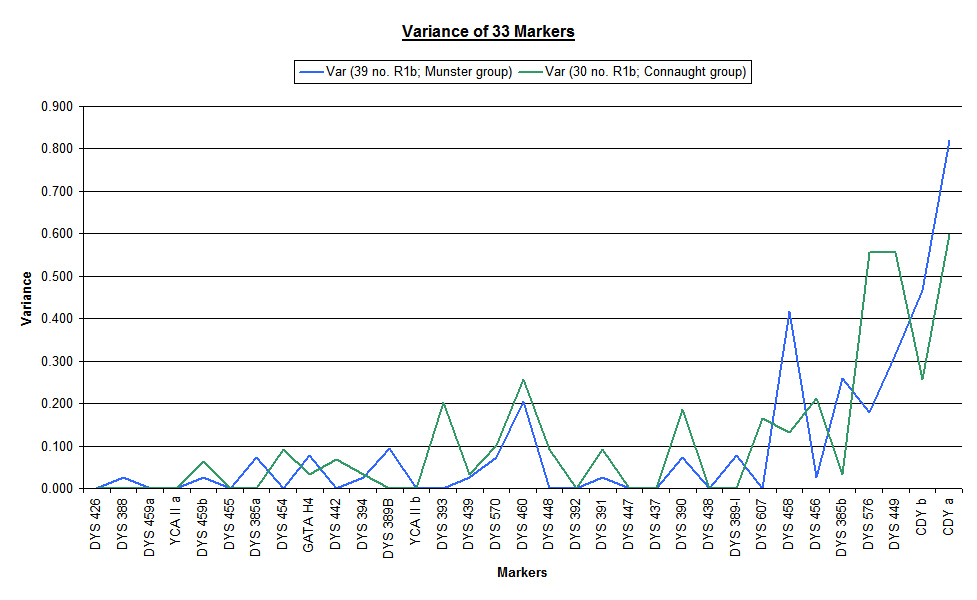
The final chart in this series highlights the difference between the variance of each of the two main groups considered as individual databases (blue line for Munster Flannerys and green line for Connaught Flannerys). It is clear from this chart that individual marker mutation rates are specific to each group.
Naturally, we shall continue to monitor the markers on an ongoing basis, and we shall establish group-specific mutation rates in due course as the database grows.
Now that we are able to meaningfully differentiate the markers as either "Faster" or "Slower"
(based on our own test results for all R1b results), we can
exercise a measure of discretion and either use or ignore them according to the applied context.
When comparing our R1b results and our R1b results,
we have ignored the faster markers and just used the slower markers with clustering. When evaluating the general groups
such as Munster Flannery versus Connaught Flannery versus Flannelly, we have used all of the markers in both faster and slower categories
with clustering. When examining the individual family structures within each group, we have used all of the markers without
clustering.
We have also employed a precaution advocated by researchers in TCD and use DYS 389B = DYS 389ii - DYS 389i to avoid the error of overestimating mutations in nested markers. Furthermore, we do not use the fast multiple marker DYS 464 (abcd) in our analysis because the results are too ambiguous. These and other multiple copy markers are under review.
The charts for comparing our R1b results and our R1b results
simply use the following 16 slower markers:-
DYS 393 ... DYS 394 ... DYS 385a ... DYS 426 ... DYS 388 ... DYS 439
DYS 389B (= DYS 389ii - DYS 389i) ... DYS 459a ... DYS 459b ... DYS 455
DYS 454 ... GATA H4 ... YCA IIa ... YCA IIb ... DYS 570 ... DYS 442
The charts for comparing groups against groups and families within each individual group use all of the above 16 slower markers and also the following 17 faster markers, 33 markers in total:-
DYS 390 ... DYS 391 ... DYS 385b ... DYS 389i ... DYS 392
DYS 458 ... DYS 447 ... DYS 437 ... DYS 448 ... DYS 449 ... DYS 460
DYS 456 ... DYS 607 ... DYS 576 ... CDY a ... CDY b ... DYS 438
Yes, two.
The following links provide further information to suit all levels. Don't forget to contact the team if you have any queries about any aspect of the project.
Theory (beginners) | Theory (advanced)
Project | Reports | Tabulated Results | Charts | How to take part